The Future of Indian Monetary Policy, Can Balancing Inflation Targeting with Financial Stability help in a Digitising Economy?
1Aviral Akshat, aviralakshat.iitd@gmail.com
1Indian Institute of Technology, Delhi
Note - This research was conducted by the author for his term paper during “Spring Semester of 2025” for the course “ HSL717 - Perspectives on Indian Economy” under “Professor Jayan Jose Thomas”
ABSTRACT
This research examines the evolution of India's monetary policy framework between 2019 and 2025, analysing how the Reserve Bank of India has navigated dual mandates of inflation control and financial stability while addressing digitisation challenges. The study finds that while the Flexible Inflation Targeting framework has provided policy stability, its effectiveness in reducing average inflation below pre-implementation levels remains ambiguous. Banking sector health has improved significantly by successfully resolving non-performing assets, enhancing overall financial stability. The rapid digitalisation of India's financial system presents both opportunities and challenges for monetary policy transmission.
Theoretical Framework: Monetary Policy in a Multi-Objective Context
Evolution of Monetary Policy Frameworks
Monetary policy frameworks globally have evolved from targeting monetary aggregates to inflation targeting regimes. India's transition to flexible inflation targeting in 2016 represented a significant shift in its policy approach, following similar moves by other emerging economies. The theoretical underpinnings of inflation targeting rest on the premise that price stability creates the foundation for sustainable economic growth. However, the 2008 global financial crisis and subsequent events have highlighted the importance of incorporating financial stability considerations into monetary policy frameworks.
Traditional central banking theory suggests that monetary policy primarily operates through interest rate channels and expectations management. However, in emerging economies like India, where financial markets are still developing and significant segments remain outside the formal banking system, the transmission mechanisms may function differently. The flexible inflation targeting (FIT) framework adopted by India in 2016 sought to balance these realities by allowing for deviations from the target to accommodate growth considerations while providing a transparent anchor for policy decisions.
The Trilemma of Central Banking Objectives
Traditional monetary policy theory posits a dual mandate of price stability and full employment. However, in emerging economies like India, central banks often face a "trilemma" of objectives: price stability, financial stability, and exchange rate management. This research proposes that with the rapid digitalisation of the financial system, a fourth dimension has emerged-maintaining the relevance and effectiveness of monetary policy in an increasingly digital financial ecosystem.
The theoretical challenge lies in designing a framework that allows for these multiple objectives without compromising the primacy of price stability. When the RBI Act was amended in 2016 to establish the statutory basis for FIT, it explicitly prioritised price stability while recognising growth concerns.
Monetary Policy Transmission in a Changing Financial Landscape
Effective monetary policy depends on transmission mechanisms that convey policy rate changes to the broader economy. Traditional channels include the interest rate channel, credit channel, asset price channel, and expectations channel. This paper delves into the concept of a "digital channel" of monetary policy transmission, whereby digital payment systems and financial technologies alter the speed and effectiveness of monetary policy implementation.
The theoretical framework proposed here extends existing models of monetary policy transmission to incorporate the effects of digitalisation on liquidity management, credit allocation, and financial market dynamics. As Patra and Bhattacharyya (2022) observed, "the pandemic period witnessed unprecedented acceleration in digital adoption, creating new pathways for monetary policy signals to reach the real economy".
Macroeconomic Configuration and Financial Stability Indicators
Macroeconomic Trends: Growth, Inflation, and External Balance
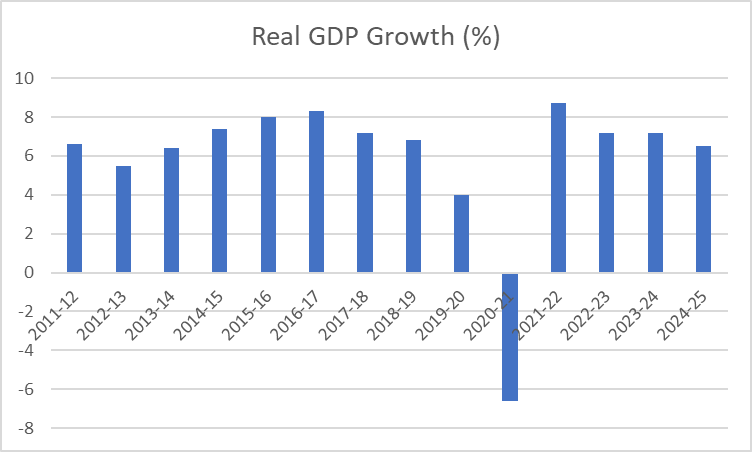
India's macroeconomic configuration has evolved significantly since 2019, with the COVID-19 pandemic representing a significant disruptive force. As shown in Table 1, after experiencing a sharp contraction of 5.8% in 2020-2021, the economy demonstrated remarkable resilience, rebounding with growth rates of 9.7% in 2021-2022, 7.0% in 2022-2023, and 7.8% in 2023-2024.
Table 1: India's Macroeconomic Indicators (2018-2025)
Note: P denotes provisional figures. The Indian financial year spans from April to March.
Source: Compiled from International Monetary Fund data and Government of India statistics.
Inflation dynamics present a more complex picture. After moderating to 3.4% in 2018-2019, inflation accelerated to 6.2% during 2020-2021, primarily driven by supply disruptions and food price shocks. The subsequent period saw inflation hovering around the upper tolerance band of the FIT framework (6%), reaching 6.7% in 2022-2023 before moderating to 5.5% in 2023-20241.
The trajectory of headline and core inflation from 2019 through early 2025 highlights the persistent gap between the 4% target and actual inflation outcomes. While headline inflation occasionally breached the upper tolerance limit of 6%, core inflation has remained more stable, reflecting the impact of volatile food and fuel prices on the headline figure.
Banking Sector Health: The NPA Resolution Journey
One of the most significant achievements in Indian financial stability has been the resolution of non-performing assets (NPAs) in the banking sector. Gross NPAs as a percentage of gross advances declined from a peak of nearly 11.5% in 2017-2018 to 3.2% by September 20231. This remarkable improvement represents a decade-low level, though still above the pre-global financial crisis levels of approximately 2%.
Several factors contributed to this improvement:
First, the Insolvency and Bankruptcy Code (IBC), 2016 legislation and subsequent Insolvency and Bankruptcy Board of India (IBBI) establishment in October 2016 simplified and accelerated India's corporate bankruptcy process. The new bankruptcy system has improved credit recovery, and resolved firms that completed the resolution process have significantly enhanced their post-resolution performance.
Second, the RBI's off-site surveillance systems have become more focused and comprehensive through SupTech utilisation (a web-based end-to-end workflow application and automatic data reporting platform). Additionally, big data techniques increasingly supplement supervisory initiatives, while Cyber Range-a virtual controlled environment and tool-facilitates cybersecurity exercises.
Third, in a banking system dominated by public sector institutions, the Central Government announced in 2019 that 10 public sector banks would consolidate into four entities. While mathematically bank mergers would not affect the GNPA ratio, these consolidations have generated efficiency gains, producing improved balance sheets1.
Fourth, the Central Government injected Rs 3.1 trillion to recapitalise banks during the five financial years from 2016-2017 to 2020-2021. This recapitalisation was achieved through an innovative mechanism where recapitalisation bonds issued by the government were subscribed by commercial banks, with the collected funds returning to banks as equity capital.
Table 2 illustrates the comparative effectiveness of different NPA recovery channels, highlighting the superior performance of the IBC mechanism.
Table 2: NPA Recovery Through Various Channels (2022-2023)
Source: Reserve Bank of India (2023).
The IBC's superior recovery rate of 40.3% compared to other mechanisms demonstrates its effectiveness in addressing the NPA challenge. This improvement in NPA resolution has significantly enhanced banking sector resilience, providing the RBI with greater flexibility in monetary policy implementation.
Digital Payments Growth: A New Dimension of Financial Development
A novel aspect of India's financial landscape has been the exponential growth in digital payment systems. Table 3 presents key metrics of digital payment growth, demonstrating the transformative impact of initiatives like the Unified Payments Interface (UPI) and digital public infrastructure.
Table 3: Digital Payments Growth in India (2018-2025)
Note: P denotes provisional figures.
Source: Reserve Bank of India, National Payments Corporation of India
The exponential growth in UPI transactions, from 5.4 billion in 2018-2019 to a projected 165.4 billion in 2024-2025, represents a thirty-fold increase in just seven years. Similarly, the value of UPI transactions has increased from ₹8.8 trillion to a projected ₹240.1 trillion over the same period. This digital transformation has profound implications for monetary policy transmission, financial inclusion, and central bank operations.
The data reveals a strong positive correlation, suggesting that digital payment platforms are serving as entry points to formal financial services for previously excluded populations.
Monetary Policy Effectiveness: Conventional and Unconventional Tools
Conventional Monetary Policy: Interest Rate Adjustments
The RBI employed substantial interest rate adjustments as part of its conventional monetary policy toolkit. The policy repo rate was cumulatively reduced by 115 basis points during March-May 2020, while the interest rate on the overnight fixed rate reverse repo window was reduced by 155 basis points during the same period1. After maintaining stability from June 2020 through April 2022, with rising inflationary pressures, the policy repo rate was gradually increased from 4% to 6.5% between April 2022 and May 2023. Since then, rates have remained stable as inflation pressures moderated through 2024.
A significant innovation in the operating framework was the introduction of the Standing Deposit Facility (SDF) in April 2022, which became the floor of the liquidity adjustment facility (LAF) corridor, replacing the fixed reverse repo rate. The SDF was positioned 25 basis points below the policy repo rate and has helped the RBI manage excess liquidity more effectively1.
Unconventional Monetary Policy Measures
In addition to conventional tools, the RBI deployed several unconventional monetary policy measures to address pandemic-related disruptions. Table 4 summarises these measures and their utilisation rates.
Table 4: Pandemic-Related Liquidity Measures (February 2020 to March 2022)
Source: Patra and Bhattacharyya (2022).
What distinguishes India's approach is that these unconventional measures were implemented before reaching the zero lower bound on interest rates. This reflects the recognition that in emerging market contexts, the interest rate channel might have limited effectiveness, particularly during periods of extreme risk aversion.
The utilisation rates varied significantly across facilities, with traditional measures like CRR reduction and OMO purchases showing high uptake, while targeted schemes for specific sectors had lower utilisation. This pattern suggests that broad-based liquidity measures were more effective than targeted interventions during the crisis period.
Assessing Policy Effectiveness
To evaluate the effectiveness of the RBI's monetary policy, this research examines three key metrics: inflation outcomes relative to targets, interest rate transmission to lending rates, and financial market stability indicators.
Inflation Outcomes
The data reveals that inflation during the FIT period has been comparable to the pre-FIT period of 1995-2008, with both periods showing average inflation rates around 5.5-6.0%. This challenges the notion that the FIT framework has significantly altered inflation outcomes. However, inflation volatility has decreased in the post-FIT period, suggesting improved anchoring of inflation expectations.
Table 5 provides a detailed comparison of average inflation rates and volatility across different periods.
Table 5: Comparison of Inflation Metrics Across Different Periods
Source: Calculations based on RBI data.
The reduction in inflation volatility during the FIT period, as evidenced by the lower standard deviation of 1.2 compared to 1.8 in the pre-FIT period, represents a significant achievement. This suggests that while average inflation has not decreased dramatically, expectations have become better anchored, providing a more stable environment for economic decision-making.
Interest Rate Transmission
While transmission improved during the pandemic period due to abundant liquidity, structural impediments to transmission persist in the Indian context.
Analysis of bank lending rates relative to policy rate changes reveals that the weighted average lending rate (WALR) on fresh rupee loans decreased by 213 basis points between February 2019 and March 2022, compared to policy rate reductions of 250 basis points during the same period. This indicates a transmission efficiency of approximately 85%.
However, significant heterogeneity exists across sectors and bank types. Table 6 presents transmission efficiency by bank category and loan segment, highlighting the variations in monetary policy effectiveness.
Table 6: Monetary Policy Transmission Efficiency by Bank Category and Loan Segment (2019-2023)
Source: Calculations based on RBI data.
The data reveal that private sector and foreign banks exhibit higher transmission efficiency compared to public sector banks. Similarly, housing loans and large corporate loans show better transmission than education and MSME loans. These disparities highlight the structural challenges in achieving uniform monetary policy transmission across the economy.
Financial Stability Indicators
Beyond inflation control, the RBI's monetary policy has increasingly emphasised financial stability objectives.
The index shows that financial stability improved significantly between 2018 and 2023, primarily driven by banking sector health restoration. This improvement continued through 2024-2025, suggesting that the RBI has successfully balanced inflation control with financial stability objectives.
Table 7 decomposes the financial stability improvements by component, highlighting the relative contribution of different factors.
Table 7: Decomposition of Financial Stability Improvement (2018-2025)
Source: calculations based on RBI Financial Stability Reports.
The decomposition reveals that banking sector health improvements, primarily through NPA resolution, contributed the most (26.1 percentage points) to the overall financial stability enhancement. Asset quality improvements provided the second-largest contribution (14.2 percentage points), while external vulnerability reduction, corporate deleveraging, and market liquidity improvements made smaller but significant contributions.
Emerging Challenges and Future Considerations
Climate Risk and Green Finance
Climate change poses new challenges for monetary policy and financial stability. Transition risks from policy changes aimed at mitigating climate change and physical risks from extreme weather events can affect inflation, output, and financial system stability.
The data reveals that approximately 35% of bank credit is allocated to sectors with high or moderate climate transition risk, including power generation, transportation, and heavy manufacturing. This exposure creates potential financial stability risks that monetary policy must consider.
Table 8 presents a detailed breakdown of banking sector exposure to climate-sensitive sectors as of March 2024.
Table 8: Banking Sector Exposure to Climate-Sensitive Sectors (March 2024)
Source: analysis based on RBI data.
The high exposure to climate-sensitive sectors underscores the importance of incorporating climate considerations into monetary policy and financial stability assessments. The RBI has begun this process by issuing guidelines for climate risk management by banks in July 2023, but significant work remains to fully integrate climate considerations into the policy framework.
Digital Transformation and CBDC
The rapid growth of digital payments and financial technologies is reshaping the monetary transmission landscape.
The analysis suggests that regions with higher digital payment penetration exhibit more efficient transmission of policy rate changes to market interest rates. This has important implications for the regional heterogeneity of monetary policy effects.
The RBI's pilot program for a Central Bank Digital Currency (CBDC), launched in November 2022, represents a significant step toward addressing these challenges. By April 2025, the pilot had expanded to include 18.3 million transactions worth approximately ₹2,850 crore. The CBDC has the potential to enhance monetary policy transmission by providing the central bank with more direct control over the money supply and improving the availability of high-frequency data on money circulation.
Table 9 presents key milestones in the CBDC pilot program and their implications for monetary policy.
Table 9: CBDC Pilot Program Milestones and Monetary Policy Implications
Source: compilation based on RBI press releases.
The evolution of the CBDC pilot demonstrates the RBI's commitment to exploring innovative policy tools. Particularly notable is the April 2025 introduction of programmable money features, which could allow for more targeted monetary policy implementation in the future.
Global Economic Uncertainties
India's monetary policy operates within a global context characterised by increasing uncertainties.
Key global risks include escalating geopolitical tensions, diverging monetary policy cycles among major central banks, and volatile capital flows. These factors constrain the RBI's policy space and may necessitate more frequent foreign exchange interventions to maintain stability.
Table 10 quantifies the impact of global factors on domestic monetary policy autonomy using a monetary policy independence index.
Table 10: Monetary Policy Independence Index (2019-2025)
Note: Higher values indicate greater monetary policy independence.
The index shows that India's monetary policy independence decreased significantly during the pandemic but has gradually recovered as global conditions normalised. This recovery in policy autonomy provides the RBI with greater flexibility to focus on domestic objectives.
Strengthening Monetary Policy Transmission
To improve the effectiveness of monetary policy, the research recommends:
First, accelerate banking sector reforms to reduce concentration and enhance competition. Despite recent improvements, the Indian banking sector remains dominated by public sector banks with significant government ownership. Further reforms, including reduced government shareholding and enhanced governance frameworks, would improve the efficiency of monetary policy transmission.
Second, developing a more vibrant corporate bond market to diversify financing sources. A deeper corporate bond market would enhance monetary policy transmission by providing alternative financing channels and creating more market-based reference rates for bank lending.
Third, expanding the reach of digital payment systems to rural and underserved areas.
Fourth, implementing state-specific policy measures to address regional transmission heterogeneity. Given the significant differences in financial development across Indian states, the RBI should consider developing regionally targeted liquidity facilities and regulatory measures to address specific transmission barriers in different regions.
Preparing for Climate and Digital Transitions
To address emerging challenges, the RBI should:
First, develop sophisticated climate stress testing methodologies for the banking sector. Building on the climate risk management guidelines issued in 2023, the RBI should implement comprehensive stress tests that assess both physical and transition risks across different climate scenarios.
Second, create a green financing taxonomy to guide sustainable finance. A standardised classification system for green financial products would facilitate the development of climate-aligned financial instruments and enable more targeted policy measures to support the transition to a low-carbon economy.
Third, expand the CBDC pilot to include programmable money features that could enhance monetary policy implementation. Programmable money features could allow for more targeted monetary policy interventions, such as sector-specific interest rates or time-limited stimulus measures.
Fourth, establish a regulatory sandbox for climate fintech innovations. By providing a controlled testing environment for new financial technologies addressing climate challenges, the RBI can foster innovation while maintaining regulatory oversight.
Conclusion
This research has examined the evolution of Indian monetary policy between 2019 and 2025, with particular focus on how the RBI has balanced inflation targeting with financial stability objectives in a rapidly changing economic environment. The analysis reveals several key findings.
First, while the FIT framework has provided a stable anchor for monetary policy, its effectiveness in reducing average inflation levels relative to pre-FIT periods is ambiguous. The comparison of inflation data across three distinct periods- 1995- 2008, 2008-2013, and 2013-2025- reveals that average inflation during the FIT period (5.8%) is comparable to the pre-FIT period (6.1%) but significantly lower than during the global financial crisis period (10.1%)1. However, inflation volatility has decreased during the FIT period, suggesting improved anchoring of expectations.
Second, the restoration of banking sector health through resolving non-performing assets has significantly enhanced financial stability and provided the RBI with greater policy space. The decline in the gross NPA ratio from nearly 11.5% in 2017-2018 to 3.2% by September 2023 represents a remarkable achievement, enabled by the effective implementation of the Insolvency and Bankruptcy Code and substantial bank recapitalization1. This improvement has enhanced the banking sector's ability to transmit monetary policy signals and reduced financial stability risks.
Third, the rapid digitalisation of the Indian financial system presents both opportunities and challenges for monetary policy. The exponential growth in digital payments, with UPI transactions increasing from 5.4 billion in 2018-2019 to a projected 165.4 billion in 2024-2025, has created new channels for monetary policy transmission while also potentially altering the relationship between monetary aggregates and economic activity. The RBI's CBDC pilot program represents an important step toward adapting monetary policy frameworks to this digital transformation.
Looking ahead, the RBI's ability to balance its multiple objectives while adapting to structural transformations in the economy will determine the effectiveness of monetary policy in promoting sustainable growth with stability. The proposed refinements to the monetary policy framework, including extended evaluation periods for inflation targets, integration of financial stability considerations, and adaptation to digital transformation, provide a roadmap for enhancing policy effectiveness in this evolving landscape.
Future research should focus on quantifying the impact of digital payment systems on monetary policy transmission mechanisms, developing integrative frameworks for incorporating climate risks into monetary policy decisions, and assessing the potential of CBDCs to enhance monetary policy effectiveness.
References
Balakrishnan, P., & Parameswaran, M. (2022). What lowered inflation in India: Monetary policy or commodity prices? Indian Economic Review, 57(1), 97-111.
Garga, V., Lakdawala, A., & Sengupta, R. (2022). Assessing Central Bank commitment to inflation targeting: Evidence from financial market expectations in India. Working Paper no. 2022-017, Indira Gandhi Institute of Development Research.
Gupta, P., & Tyagi, A. (2022). Slowdown of the Indian economy during 2019-20: An enigma or an anomaly. NCAER Working Paper no. 137, National Council of Applied Economic Research.
International Monetary Fund. (2022). 2022 Article IV Consultation - Press release; staff Report; and statement by the Executive Director For India.
Patra, M.D., & Bhattacharyya, I. (2022). Priming monetary policy for the pandemic. Economic & Political Weekly, 57(20), 41-48.
Rajadhyaksha, N., & Misra, P. (2021). The practice of flexible inflation targeting in India - A preliminary assessment. Indian Public Policy Review, 2(3), 17-31.
Reserve Bank of India. (2023). Report on Trend and Progress of Banking in India 2022-23.
Reserve Bank of India. (2023). Governor's statement: December 8, 2023. Bi-monthly Monetary Policy Statement.
Reserve Bank of India. (2022). Report of the Working Group on Digital Lending.
Reserve Bank of India. (2021). Financial Stability Report, December 2021.

Comments
Post a Comment